Setup T-pot for Threat Intelligence

T-pot is a multi honeypot platform that runs over 20 different honeypots and sends everything into the Elastic Stack so you can visualize attacks in real time. In this guide I walk through how I set up my deployment and added some small tweaks. The goal of this project is to collect real attack data, study what hits the server, and build some threat hunting experience from live internet traffic.
Building a Honeypot for Some Threat Hunting and Malware Analysis
Introduction & What Is T-pot?
This guide documents the complete setup I did for my T-pot deployment.
- 20+ honeypots simulating various services (SSH, Telnet, HTTP, databases, ICS/SCADA, etc.)
- Elastic Stack (Elasticsearch, Log stash, Kibana) for log aggregation and visualization
- Network Security Monitoring tools (Suricata, P0f, Fatt)
- Real-time attack visualization with a cool Pew Pew map :D
- Additional tools (CyberChef, Elasticvue, Spiderfoot) Just for convenience
My Project Goals
- Capture attack telemetry and malware samples
- Create a convincing environment that keeps attackers engaged
- Analyze attacker behavior and command patterns
- Build threat intelligence from live attack data
Note: Once I gather over 3 million attacks, I will be doing a part two on this post where I demonstrate some interesting things I found and how I used it.
Part 1: Initial Server Setup
Infrastructure Specifications (what I am using)
Provider: Hetzner Cloud
OS: Ubuntu 24.04 LTS
Resources: 16GB RAM minimum (16GB recommended for full Hive installation - trust me anything lower will be trash after a while)
Storage: 128GB+ SSD free disk space
Once you finish picking a cloud provider and creating the VM move onto the initial configuration
Initial Configuration
1
2
3
4
5
6
7
8
# Connect to fresh Ubuntu server
ssh root@<SERVER_IP>

# Update system packages
apt-get update && apt-get upgrade -y

# Install required dependencies
apt-get install curl git -y
Create Non-Root User
1
2
3
4
5
6
7
# Create administrative user with strong password (we need to run T-pot on a non root user, the user I chose was Chad :p )
adduser chad
usermod -aG sudo chad

# Switch to new user
su - chad
cd ~
Part 2: T-Pot Installation
Clone and Install
1
2
3
4
5
6
# Clone the official T-Pot repository
git clone https://github.com/telekom-security/tpotce.git
cd tpotce

# Run the installer
./install.sh
Installation Options
During installation, you’ll be prompted for:
- Install?: Select “y”
- Installation Type: Select “H” (Hive) for the full standard installation with all honeypots
- Web UI Credentials: Create a username and strong password for accessing the T-pot web
Reboot and Verify
1
2
# Reboot as instructed
sudo reboot
What the Installer Does
The T-Pot installer automatically:
- Changes SSH port from 22 → 64295 (for security)
- Installs Docker and Docker Compose
- Disables DNS Stub Listener (prevents port conflicts)
- Sets firewall to ACCEPT for public zone
- Creates tpot system user/group for services
- Adds helpful shell aliases (dps, dpsw, la, ll, mi)
- Sets up systemd service for automatic startup
- Configures daily automatic reboot (2:42 AM by default)
Wait 60-90 seconds for the system to restart, then reconnect:
1
2
# Connect via new SSH port (Now SSH port 22 is → 64295 )
ssh -p 64295 chad@<SERVER_IP>
Part 3: Verification and Access
Check T-Pot Status
1
2
3
4
5
6
7
8
# Verify T-Pot service is running
sudo systemctl status tpot

# View all running containers (custom alias installed by T-Pot)
dps

# Watch containers in real-time (refreshes every 5 seconds)
dpsw 5
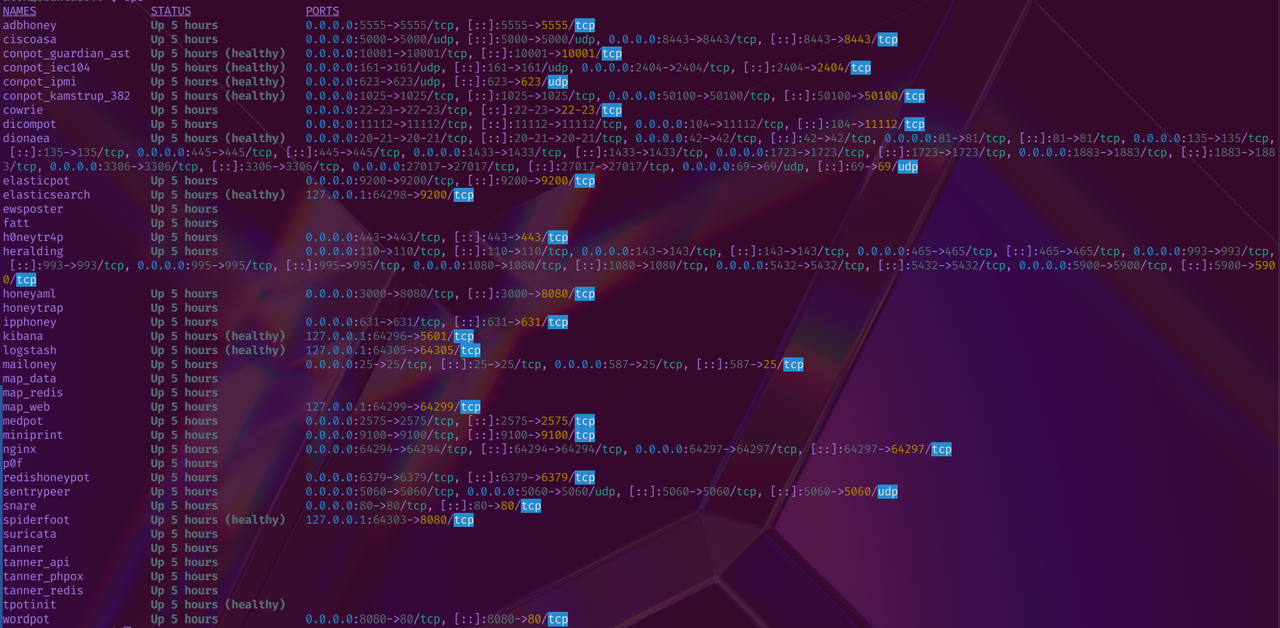
You should see 30+ containers running, including:
- Honeypots: cowrie, dionaea, elasticpot, heralding, snare, etc.
- Logging: elasticsearch, logstash, kibana
- Monitoring: suricata, p0f, fatt
- Tools: nginx, spiderfoot, map_web
Access Web Interface
Open your browser and go to:
1
https://<SERVER_IP>:64297
Accept the self-signed certificate warning and log in with the Web UI credentials you created during installation.
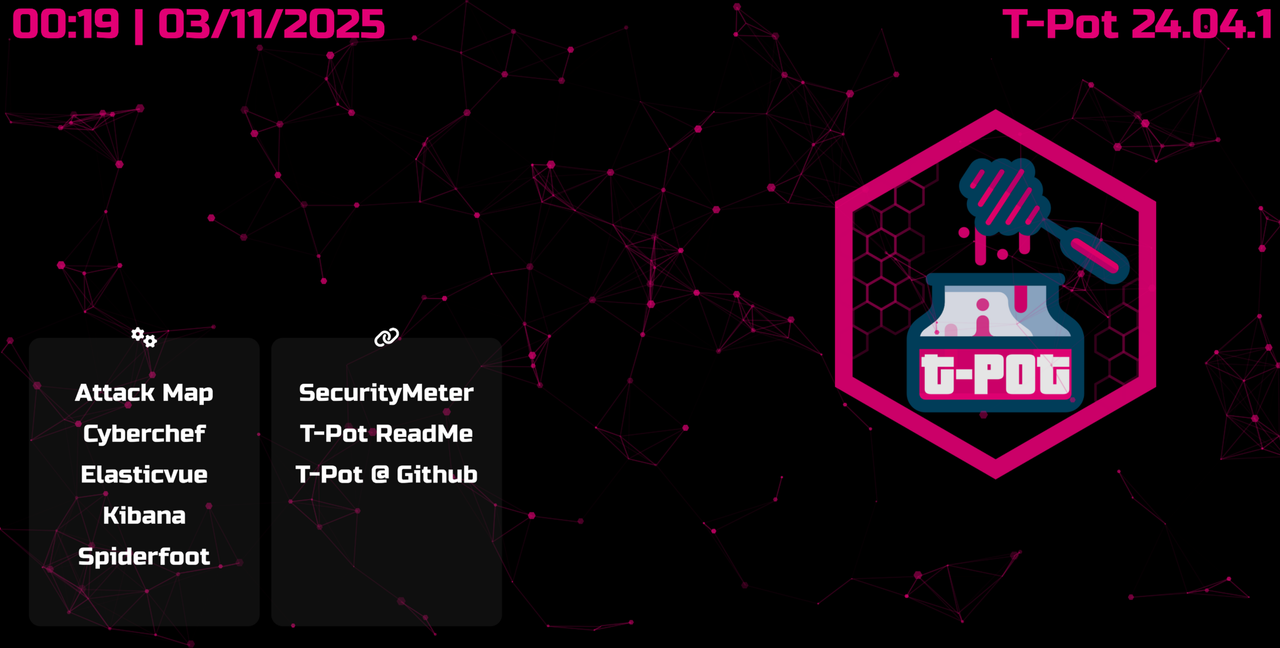
Available Tools:
- Kibana - Search and visualize attack data with pre-built dashboards
- Attack Map - Real-time animated visualization of attacks
- CyberChef - Data encoding/decoding/analysis toolkit
- Elasticvue - Elasticsearch cluster browser. This is a user-friendly GUI for Elasticsearch, which not be necessary in my honeypot deployment where I keep the operations simple and focus on testing or learning.
- Spiderfoot - OSINT automation tool
Part 4: Understanding T-Pot Architecture
Honeypots Deployed
Your T-Pot installation include some honeypots like:
| Honeypot | Ports | Purpose |
|---|---|---|
| Cowrie | 22, 23 | SSH/Telnet - Logs commands |
| Dionaea | 21, 445, 1433, 3306, etc. | Malware collection (SMB, FTP, MSSQL, MySQL) |
| Elasticpot | 9200 | Fake Elasticsearch instance |
| Heralding | Multiple | Multi-protocol credential harvester |
| Snare/Tanner | 80 | Web application honeypot |
| Conpot | 102, 502, 161, etc. | Industrial Control Systems (ICS/SCADA) |
| ADBHoney | 5555 | Android Debug Bridge (IoT malware) |
| Mailoney | 25 | SMTP honeypot |
| Redishoneypot | 6379 | Redis honeypot |
| SentryPeer | 5060 | VoIP/SIP honeypot |
Data Flow
1
2
3
4
5
6
7
8
9
Internet → Honeypots (Ports 1-64000)
              ↓
         Suricata (Network IDS)
              ↓
         Logstash (Log Processing)
              ↓
      Elasticsearch (Storage)
              ↓
         Kibana (Visualization)
File Structure
1
2
3
4
5
6
7
8
9
~/tpotce/
├── .env                    # Main configuration file
├── docker-compose.yml      # Active container definitions
├── data/                   # Persistent data (logs, artifacts)
│   ├── cowrie/            # Cowrie honeypot data
│   ├── dionaea/           # Dionaea malware samples
│   ├── elasticsearch/     # Elasticsearch indices
│   └── [other honeypots]/
└── compose/               # Alternative configuration templates
Part 5: Customizing Cowrie Honeypot
To make the honeypot a bit more realistic, we’ll customize the Cowrie SSH/Telnet honeypot with a “convincing” server identity and fake credentials.
Extract Cowrie Configuration
1
2
3
4
5
6
7
8
9
10
11
# Stop T-Pot
sudo systemctl stop tpot

# Create directory for custom config
mkdir -p ~/tpotce/data/cowrie/etc

# Copy configuration from running container
docker cp cowrie:/home/cowrie/cowrie/cowrie.cfg ~/tpotce/data/cowrie/etc/cowrie.cfg

# Fix ownership (T-Pot runs as tpot:tpot user)
sudo chown -R tpot:tpot ~/tpotce/data/cowrie/etc/
Customize Hostname and System Info
1
2
# Edit the configuration
nano ~/tpotce/data/cowrie/etc/cowrie.cfg
Modify these settings for realism(you can put whatever you like):
1
2
3
4
5
6
7
8
9
10
11
12
13
[honeypot]
hostname = prod-app-server-01

[shell]
arch = linux-x64-lsb
kernel_version = 5.15.0-91-generic
kernel_build_string = #101-Ubuntu SMP Tue Nov 14 13:30:08 UTC 2023
hardware_platform = x86_64
operating_system = GNU/Linux
ssh_version = OpenSSH_8.2p1, OpenSSL 1.1.1f 31 Mar 2020

[ssh]
version = SSH-2.0-OpenSSH_8.2p1 Ubuntu-4ubuntu0.5
Key Changes:
- hostname: Changed from generic “ubuntu” to “prod-app-server-01” (mimics production naming convention. If you dont change this then all they will see is “Ubuntu” when they SSH/Telnet)
- kernel_version: Updated to realistic production kernel
- arch: Simplified to standard x64 Linux
Mount Custom Configuration
Edit the docker-compose file to use your custom config:
1
2
3
4
5
# Backup original
cp ~/tpotce/docker-compose.yml ~/tpotce/docker-compose.yml.backup

# Edit compose file
nano ~/tpotce/docker-compose.yml
Find the cowrie section and add line 23 to this volume mount:
1
2
3
4
5
6
7
8
9
10
11
12
13
14
15
16
17
18
19
20
21
22
23
  cowrie:
    container_name: cowrie
    restart: always
    depends_on:
      tpotinit:
        condition: service_healthy
    tmpfs:
      - /tmp/cowrie:uid=2000,gid=2000
      - /tmp/cowrie/data:uid=2000,gid=2000
    networks:
      - cowrie_local
    ports:
      - "22:22"
      - "23:23"
    image: ${TPOT_REPO}/cowrie:${TPOT_VERSION}
    pull_policy: ${TPOT_PULL_POLICY}
    read_only: true
    volumes:
      - ${TPOT_DATA_PATH}/cowrie/downloads:/home/cowrie/cowrie/dl
      - ${TPOT_DATA_PATH}/cowrie/keys:/home/cowrie/cowrie/etc
      - ${TPOT_DATA_PATH}/cowrie/log:/home/cowrie/cowrie/log
      - ${TPOT_DATA_PATH}/cowrie/log/tty:/home/cowrie/cowrie/log/tty
      - ${TPOT_DATA_PATH}/cowrie/etc/cowrie.cfg:/home/cowrie/cowrie/cowrie.cfg:ro
Note the :ro (read-only) flag for safety.
Validate and Restart
1
2
3
4
5
6
7
8
9
10
11
# Validate Docker Compose syntax
docker compose config

# Start T-Pot
sudo systemctl start tpot

# Wait for containers to initialize
sleep 30

# Verify Cowrie is running
docker logs cowrie | tail -20
Part 6: Adding Fake Credentials
To make the honeypot more enticing, we’ll add realistic fake credentials and configuration files >:D
Extract Honeypot Filesystem
1
2
3
4
5
6
7
8
9
10
# Stop T-Pot
sudo systemctl stop tpot

# Copy the original filesystem structure from container
docker run --rm -v ~/tpotce/data/cowrie/honeyfs:/backup \
  ghcr.io/telekom-security/cowrie:24.04.1 \
  sh -c "cp -r /home/cowrie/cowrie/honeyfs/* /backup/"

# Fix ownership
sudo chown -R tpot:tpot ~/tpotce/data/cowrie/honeyfs/
Add Fake Credentials to User Files
I Created fake credentials in phil’s .bashrc:
1
2
3
4
5
6
7
8
9
10
11
12
13
14
cat > ~/tpotce/data/cowrie/honeyfs/home/phil/.bashrc << 'EOF'
# .bashrc

# Database credentials (DO NOT COMMIT TO GIT!)
export DB_HOST="10.0.1.50"
export DB_USER="prodadmin"
export DB_PASS="MySQL_Pr0d_2024!"

# AWS Keys
export AWS_ACCESS_KEY_ID="AKIA3EXAMPLE7ABCDEFG"
export AWS_SECRET_ACCESS_KEY="wJalrXUtnFEMI/K7MDENG/bPxRfiCYEXAMPLEKEY"

alias proddb='mysql -h $DB_HOST -u $DB_USER -p$DB_PASS'
EOF
I added production access info to phil’s .profile:
1
2
3
4
5
6
7
8
9
10
11
12
13
14
15
16
17
cat > ~/tpotce/data/cowrie/honeyfs/home/phil/.profile << 'EOF'
# .profile

# Set PATH
export PATH=/usr/local/bin:/usr/bin:/bin

# Production SSH keys
export SSH_KEY_PATH="/home/phil/.ssh/id_rsa_prod"

# Database quick connect
export DATABASE_URL="postgresql://phil:[email protected]:5432/webapp"

# Load bashrc
if [ -f "$HOME/.bashrc" ]; then
    . "$HOME/.bashrc"
fi
EOF
I added root-level production credentials:
1
2
3
4
5
6
7
8
9
10
11
12
13
14
15
16
17
18
cat > ~/tpotce/data/cowrie/honeyfs/root/.bashrc << 'EOF'
# Root's .bashrc

# Production Database
export PROD_DB="mysql://root:[email protected]/production"

# Redis
export REDIS_MASTER="redis://:[email protected]:6379"

# Backup credentials
export BACKUP_USER="backup"
export BACKUP_PASS="BackupSigma123"

# SSH to production servers
alias ssh-prod-db="ssh [email protected]"
alias ssh-prod-web="ssh [email protected]"
alias ssh-prod-cache="ssh [email protected]"
EOF
Fix ownership:
1
sudo chown -R tpot:tpot ~/tpotce/data/cowrie/honeyfs/
Mount Filesystem
Edit docker-compose.yml and add the honeyfs mount:
1
nano ~/tpotce/docker-compose.yml
Add this line to the cowrie volumes section line 24:
1
      - ${TPOT_DATA_PATH}/cowrie/honeyfs:/home/cowrie/cowrie/honeyfs:ro
Full cowrie section should now look like:
1
2
3
4
5
6
7
8
9
10
11
12
13
14
15
16
17
18
19
20
21
22
23
24
  cowrie:
    container_name: cowrie
    restart: always
    depends_on:
      tpotinit:
        condition: service_healthy
    tmpfs:
      - /tmp/cowrie:uid=2000,gid=2000
      - /tmp/cowrie/data:uid=2000,gid=2000
    networks:
      - cowrie_local
    ports:
      - "22:22"
      - "23:23"
    image: ${TPOT_REPO}/cowrie:${TPOT_VERSION}
    pull_policy: ${TPOT_PULL_POLICY}
    read_only: true
    volumes:
      - ${TPOT_DATA_PATH}/cowrie/downloads:/home/cowrie/cowrie/dl
      - ${TPOT_DATA_PATH}/cowrie/keys:/home/cowrie/cowrie/etc
      - ${TPOT_DATA_PATH}/cowrie/log:/home/cowrie/cowrie/log
      - ${TPOT_DATA_PATH}/cowrie/log/tty:/home/cowrie/cowrie/log/tty
      - ${TPOT_DATA_PATH}/cowrie/etc/cowrie.cfg:/home/cowrie/cowrie/cowrie.cfg:ro
      - ${TPOT_DATA_PATH}/cowrie/honeyfs:/home/cowrie/cowrie/honeyfs:ro
Restart and Verify
1
2
3
4
5
6
7
8
9
# Validate configuration
docker compose config

# Start T-Pot
sudo systemctl start tpot
sleep 30

# Check Cowrie logs
docker logs cowrie | tail -20
Part 7: Testing the Honeypot
Test SSH Access
1
2
3
4
5
#connect to the honeypot as an "attacker". Any username will work for ssh.
ssh bruh@<SERVER_IP>

# Try common passwords - Cowrie will accept after a few attempts in telnet (this is to make it more realistic)
# Password attempts: admin, password, 123456, etc.
Verify Customizations
Once logged in, verify your customizations are visible:
1
2
3
4
5
6
7
8
9
10
11
12
13
14
15
16
# Check hostname
hostname
# Output: prod-app-server-01

# Check kernel
uname -a
# Output: Linux prod-app-server-01 5.15.0-91-generic #101-Ubuntu SMP...

# Check fake credentials
cat /home/phil/.bashrc
# Should show fake AWS keys and database passwords

# Check root credentials
cd /root
cat .bashrc
# Should show production server access info
What Attackers Will See
Attackers who compromise the honeypot will discover:
- Realistic production server naming
- Fake database credentials
- Fake AWS API keys
- Redis passwords
- SSH aliases to internal servers
- Environment variables with sensitive data
My goal for this is to keep them enaged longer so I can study their techniques.
Part 8: Monitoring and Analysis
View Real-Time Attacks
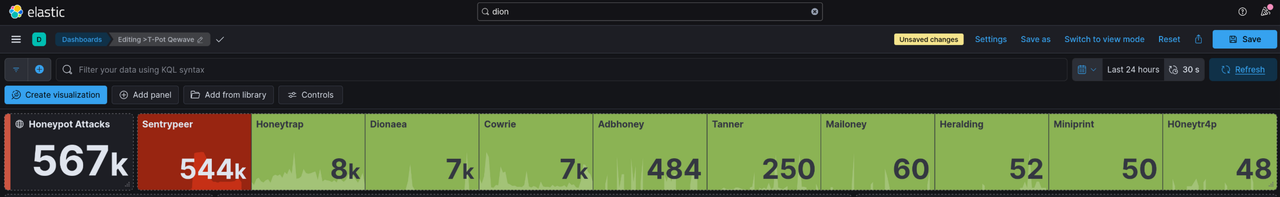
Kibana Dashboards:
- Navigate to https://SERVER_IP:64297
- Click “Kibana”
- Go to Dashboard → Select “T-Pot”
There are a lot of pre-made dashboard you can choose from. Each dashboard is basically for each honeypot.
Collected Malware
1
2
3
4
5
6
# View captured malware samples
ls -lah ~/tpotce/data/cowrie/downloads/
ls -lah ~/tpotce/data/dionaea/binaries/

# Check file types
file ~/tpotce/data/cowrie/downloads/*
Common Attack Patterns im looking for
- Brute force attempts: Username/password combinations
- Credential stuffing: Leaked credentials being tested
- Command execution: What commands do attackers run?
- Malware downloads: wget/curl commands downloading payloads
- Lateral movement attempts: SSH to other IPs
- Data exfiltration: Attempts to upload/download files
Part 9: Security Hardening
Set Up SSH Key Authentication (if you havent already)
On your local machine:
1
2
3
4
5
6
7
8
# Generate SSH key and create strong passphrase
ssh-keygen -t ed25519 -C "tpot-management"

# Copy to server
ssh-copy-id -p 64295 chad@<SERVER_IP>

# Test key-based login
ssh -p 64295 chad@<SERVER_IP>
Disable password authentication:
1
2
3
4
5
6
7
8
9
# Edit SSH config
sudo nano /etc/ssh/sshd_config

# Change these lines:
PasswordAuthentication no
PubkeyAuthentication yes

# Restart SSH
sudo systemctl restart ssh
Part 10: Maintenance (optional, this is just for later on when you actually have alot of stuff)
1
2
3
4
5
6
7
8
9
10
11
12
13
# Check T-Pot status
sudo systemctl status tpot

# View all containers
dps

# Watch for issues
dpsw 5

# Check individual container logs
docker logs cowrie
docker logs dionaea
docker logs elasticsearch
Update T-Pot
1
2
3
4
5
6
7
8
9
10
# Backup configuration first
cp ~/tpotce/.env ~/tpotce/.env.backup
cp ~/tpotce/docker-compose.yml ~/tpotce/docker-compose.yml.backup

# Run update script
cd ~/tpotce
./update.sh

# Restart T-Pot
sudo systemctl restart tpot
Clean Old Data
1
2
3
4
# T-Pot keeps logs for 30 days by default
# To manually clean old data:
cd ~/tpotce
./clean.sh
Backup Important Data
1
2
3
4
5
6
7
8
9
10
11
# Backup configuration and custom files
tar -czf tpot-backup-$(date +%Y%m%d).tar.gz \
  ~/tpotce/.env \
  ~/tpotce/docker-compose.yml \
  ~/tpotce/data/cowrie/etc/ \
  ~/tpotce/data/cowrie/honeyfs/

# Download malware samples for analysis
tar -czf malware-samples-$(date +%Y%m%d).tar.gz \
  ~/tpotce/data/cowrie/downloads/ \
  ~/tpotce/data/dionaea/binaries/
Part 11: Advanced Configuration (optional)
Adjust Data Retention
1
2
3
4
5
6
7
8
# Edit main config
nano ~/tpotce/.env

# Change retention period (days)
TPOT_PERSISTENCE_CYCLES=60

# Restart T-Pot
sudo systemctl restart tpot
I Enabled Blackhole Mode
Blackhole mode null-routes known mass scanners while still logging their activity via Suricata, reducing noise. Tbh, alot of the traffic you see comes from mass scanners. Mass scanners are Automated tools that scan the ENTIRE internet systematically. So they move on quickly. Known attackers are IPs that have been observed conducting actual malicious activities. My goal is to aim for quality over quantity. I can change it back whenever.
1
2
3
4
5
6
nano ~/tpotce/.env

# Change:
TPOT_BLACKHOLE=ENABLED

sudo systemctl restart tpot
Create Additional Web Users
1
2
3
4
5
6
7
8
# Generate new web user credentials
~/tpotce/genuser.sh

# Follow prompts to create username/password
# User will be added to ~/tpotce/.env

# Restart for changes to take effect
sudo systemctl restart tpot
Part 12: Using and Customizing Kibana
Quick note: There’s a lot you can do in Kibana. I’ll focus on the basics to help you customize your setup. In the next part of this T-Pot series, I’ll cover how to set up alerts and other advanced features. I encourage you to create dashboards based on what you’re looking for. You can get really specific with protocols. For example, I might set up a dashboard just for SSH that includes location data, successful sessions, OS fingerprints, successful sudo commands, invalid sudo attempts etc.
Using Kibana and Elastic is incredibly powerful for T-Pot monitoring.
When you first open Kibana, you’ll see a lot of fancy graphs and charts. Honestly, it’s a bit overwhelming, and I recommend creating your own dashboards. The two main sections you’ll use in the sidebar are Discover and Dashboards. Discover is where you query your logs. T-Pot comes with 30 pre-made dashboards to choose from, but the default catch-all one is the T-Pot dashboard.
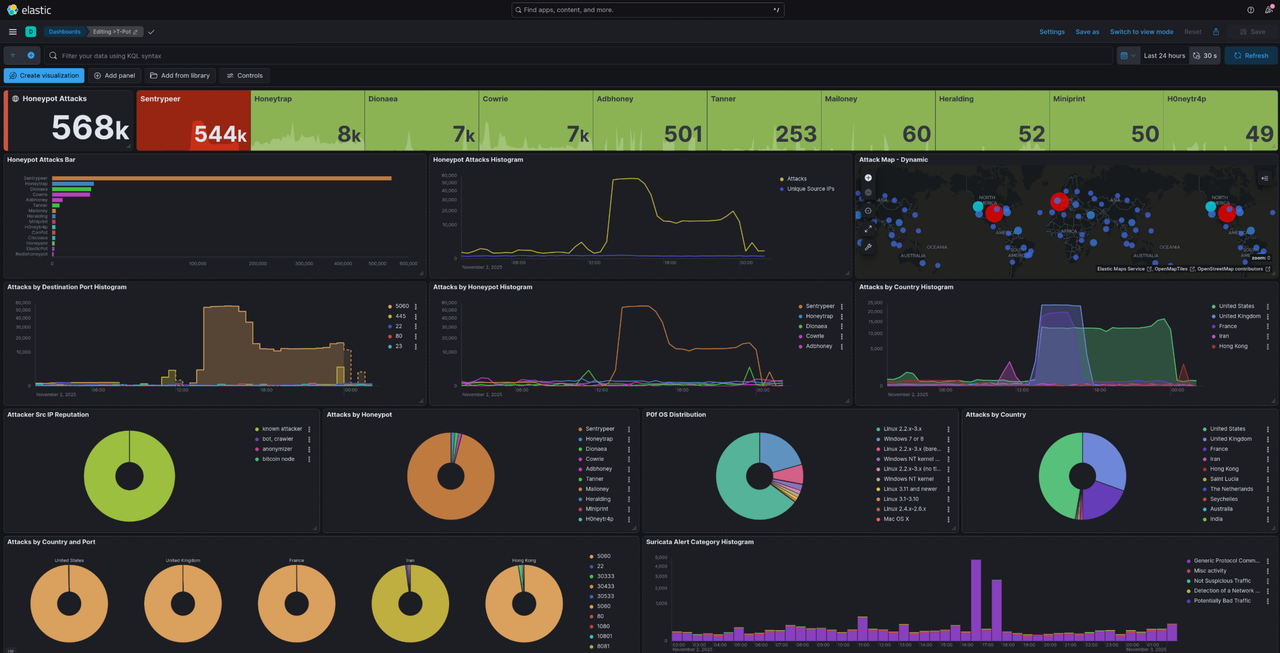
The default dashboard isn’t bad, but customizing it gives you the freedom to add whatever you want and tailor it to your goals. For me, I want to focus on tangible data like files, commands, hashes, filenames, downloaded content, and similar artifacts.
Getting Started with Customization
Once you start getting some traffic, I recommend browsing through all the dashboards to see what data each one contains and what panels are available. Once you have a sense of what’s out there, start building your own dashboard.
Here’s what I suggest:
- Go to the default T-Pot dashboard
- Click Duplicate in the top right corner
- Name it whatever you want
Once it’s duplicated, open your new dashboard and add or remove anything you like. The panels are easy to move around.
To remove a panel, just click the three dots and select Remove.
If you saw interesting panels in other dashboards that you want to include in your custom one, click Add from library on your custom dashboard. You can search by dashboard name or specific panel field name.
You can edit existing panels in your dashboard by entering edit mode and clicking Edit lens on the panel.
Tweaking Panel Settings
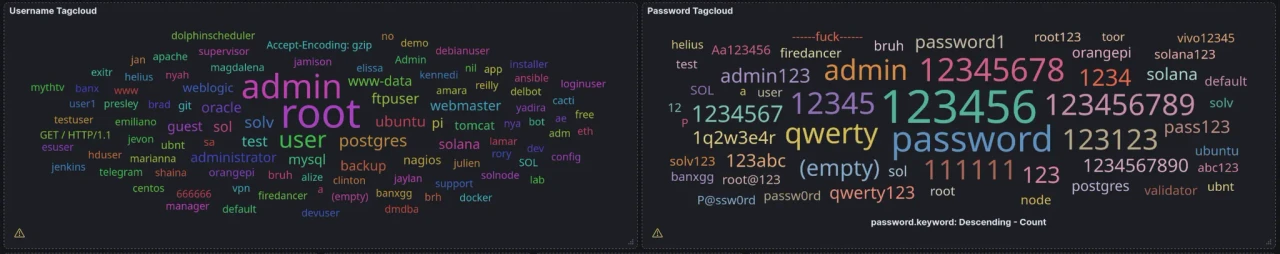
One thing I did for convenience was increase the max logs displayed in certain panels to 50 or 100. By default, most panels show “Top 10 x” values. I changed mine to show the top 50—whether it’s top 50 commands or whatever else. You can adjust this to your preference.
For example, I set the Cowrie input panel to display 50 values and renamed it “Cowrie Input Top 50.” I also did the same with the tag clouds, changing the value to 100 so more passwords are visible. If you set it to 100, you won’t be able to see all the passwords since they can’t physically fit in the panel. In that case, you can switch from a tag cloud to a table view for more granular detail.
Choosing Visualizations
You can choose different data visualizations for each panel. I like using area graphs for a lot of things because you can drag your cursor to zoom into a specific range and get all the data from that portion. 
Each piece of data you see is filterable. For example, if you want to see data related to a specific password in the tag cloud, you can click on it and view all related data for that password.
Changing Time Format
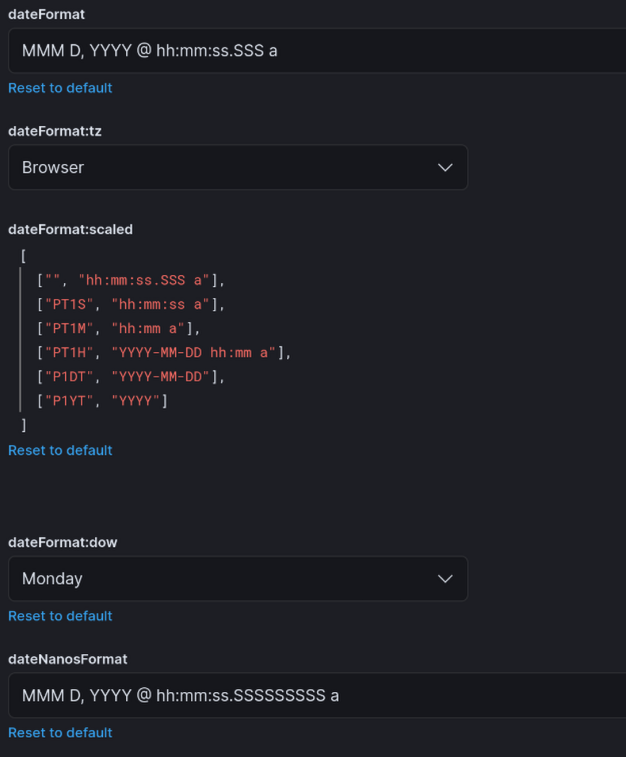
If you don’t like the 24-hour format when viewing panels, you can change it to 12-hour format:
- Click the hamburger menu on the top left
- Go to Management → Stack Management → Advanced Settings
- Update these settings:
- dateFormat →
MMM D, YYYY @ hh:mm:ss.SSS a - dateNanosFormat →
MMM D, YYYY @ hh:mm:ss.SSSSSSSSS a - dateFormat:scaled → use 12-hour tokens:
- dateFormat →
1
2
3
4
5
6
7
8
[
  ["",     "hh:mm:ss.SSS a"],
  ["PT1S", "hh:mm:ss a"],
  ["PT1M", "hh:mm a"],
  ["PT1H", "YYYY-MM-DD hh:mm a"],
  ["P1DT", "YYYY-MM-DD"],
  ["P1YT", "YYYY"]
]
Learning KQL (Kibana Query Language)
KQL is a simple, text-based language designed for filtering and searching data within Kibana’s search bar. I’m more familiar with Splunk’s Search Processing Language (SPL), but KQL is also enjoyable to use. I recommend playing around with it.
Once you master one query language, whether it’s KQL, SPL, AQL, or another, it becomes much easier to learn others. Each language has its differences, but the transferable concepts and knowing what you want to search for remain consistent. So I encourage you to experiment with it.
Next Steps
This is where I encourage you to explore. Tweak things, research what works, and use tools like VirusTotal, Cisco Talos, SpiderFoot, CyberChef, Shodan, and more. Play around with KQL, look at different dashboards, and try to pinpoint specific IPs that stand out. Focus on those and gather as much information as possible:
- When did the attack start?
- What did it target?
- How frequent was it?
- Was it successful?
I’ll be doing a Part 2 on this, showing what I’ve gathered at 3 million attacks while running t-pot 24/7, highlighting interesting findings, and demonstrating some threat hunting techniques.
Part 13: Troubleshooting
Containers Won’t Start
1
2
3
4
5
6
7
8
9
# Check for port conflicts
sudo netstat -tulpen | grep LISTEN

# View specific container logs
docker logs <container_name>

# Check system resources
htop
docker stats
Elasticsearch Issues
Elasticsearch is memory-intensive. If it’s crashing:
1
2
3
4
5
6
7
# Check memory usage
free -h

# View Elasticsearch logs
docker logs elasticsearch

# Consider upgrading to 16GB RAM for production use. Trust me its worth it.
One way to reduce the load on the system is by decreasing the number of running honeypots. You can do this in the docker-compose.yml file within ~/tpotce/docker-compose.yml. All you have to do is comment out the entire service you dont want.

restart the T-pot to apply changes sudo systemctl restart tpot
Web UI Not Accessible
1
2
3
4
5
6
7
# Check NGINX status
docker logs nginx

# Verify port is listening
sudo ss -tulpen | grep 64297

# Check firewall rules (if configured)
Useful Commands I used for reference
1
2
3
4
5
6
7
8
9
10
11
12
13
14
15
16
17
18
19
20
21
# Container Management
dps                          # View all containers
dpsw 5                      # Watch containers (5sec refresh)
docker logs -f <container>  # Follow container logs
docker stats                # Resource usage

# T-Pot Service
sudo systemctl start tpot    # Start T-Pot
sudo systemctl stop tpot     # Stop T-Pot
sudo systemctl restart tpot  # Restart T-Pot
sudo systemctl status tpot   # Check status

# Maintenance
cd ~/tpotce && ./update.sh   # Update T-Pot
cd ~/tpotce && ./clean.sh    # Clean old logs
~/tpotce/genuser.sh          # Add web user

# Access Points
ssh -p 64295 chad@<IP>       # SSH management
https://<IP>:64297           # Web UI
ssh <any_user>@<IP>          # Test honeypot
Conclusion
You now have a fully functional, customized T-Pot honeypot deployment :)
Key Takeaways
Customization matters: Generic honeypots get scanned but not deeply explored. Realistic customizations (hostnames, fake credentials, file contents) keep attackers engaged longer.
Its all about the data: The real value is understand data. Regular analysis of Kibana dashboards and collected artifacts builds threat intelligence that can be valuable for learning.
What are my next steps?
- Monitor dashboards daily for attack patterns
- Export IOCs (malicious IPs, hashes) for analysis
- Analyze malware samples in isolated sandboxes and reverse engineer them
- Share some anonymized threat intelligence with the community if they stand out to me
- Iterate on customizations based on attacker bahavior I see
Resources
- T-Pot GitHub: https://github.com/telekom-security/tpotce
- Community Dashboard: https://sicherheitstacho.eu
Acknowledgments
T-Pot is developed and maintained by Deutsche Telekom Security GmbH. This deployment builds upon their goated work to create a realistic threat intelligence collection platform.
Project Stack:
- T-Pot 24.04.1
- Ubuntu 24.04 LTS
- Docker & Docker Compose
- Elastic Stack 8.x
- 20+ open-source honeypot projects